
The EBLN Monitoring Report brings together data collected from 2 to 16 October 2024 and 1 to 15 October 2025.
Highlights include:
Traffic levels
- Overall motorised traffic decreased by 26% on weekdays and 21% on weekends when considering both internal and external roads.
- Internal roads saw a 77% reduction on weekdays and 72% on weekends.
- External roads experienced a 6% decrease on weekdays and 5% on weekends.
Walking and cycling
- Overall cycling increased by 22% on weekdays.
- Overall walking increased by 7% on weekdays and 5% on weekends.
- Use of Wesley Way cycle route increased by 60% on weekdays and 24% on weekends.
Public transport
- Bus use at stops within or on the boundary increased by about 5%.
- Bus patronage grew by 116% for services running through the area (routes 5 and 16).
Monitoring report source data
We have released a data pack, which contains the source data, that the EBLN Monitoring Report is based on. It includes:
- Bus journey times and speeds
- SCOOT data - Bristol City Council's traffic reporting dashboard
- Stats 19 – collision data
- TOMTOM - journey times
- VIVACITY - traffic counts (walking, cycling, motorised vehicles)
- Additional context – including installation dates and some maintenance works
Each data theme has its own folder and is labelled.
There is a separate folder for further information, providing additional context to the data, such as road works and construction dates.
The methodology statement explains how the data was processed and the rationale behind the approach.
Some files containing sensitive information have not been included. These are:
- Details of traffic collisions that include sensitive data fields, for example contributory factors data. See Road safety statistics: guidance - GOV.UK for more information.
- Bus patronage (ticket sale) data provided by First Bus. This is considered commercially sensitive.
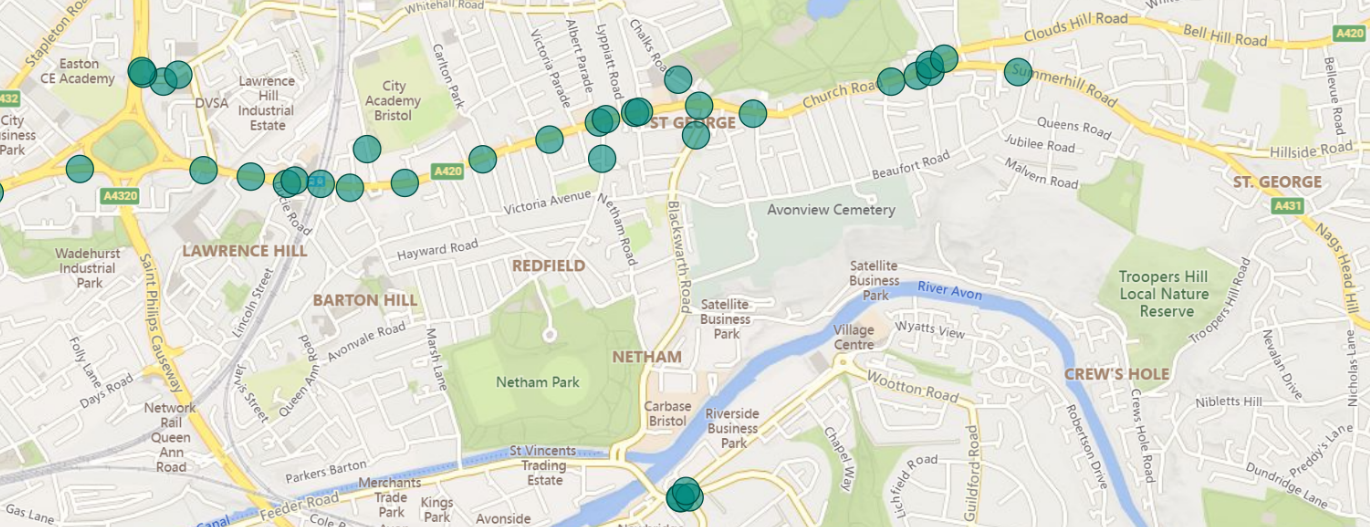
To help you interpret the VivaCity count data, the EBLN Viva City monitoring locations map lists each location referenced in the data pack and the monitoring report and shows the count lines that make up each location.
Traffic, walking and cycling levels in 2024 (pre trial)
Since February 2024, we've been collecting data on traffic levels within the East Bristol Liveable Neighbourhood scheme area. This data is complemented by the traffic data we hold on our main roads, such as Church Road.
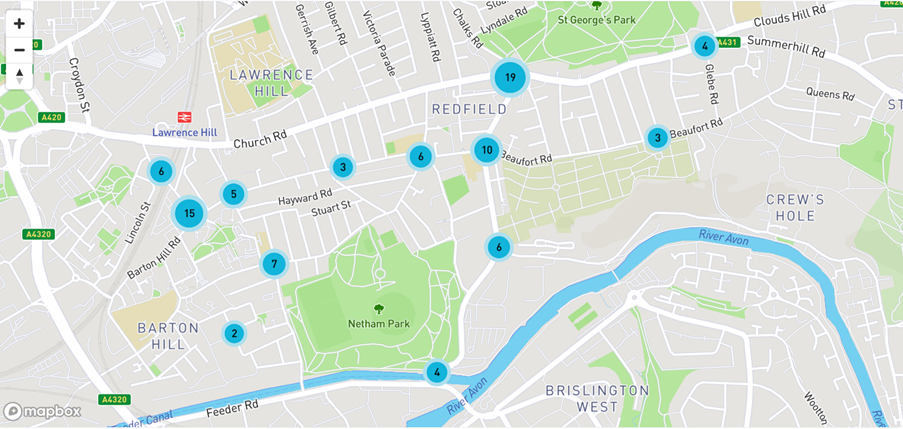
Our network of sensors within the scheme area
The numbers show how many count lines there are at each location.
Our initial perception survey tells us that the volume of traffic and the perception of an unsafe walking and cycling environment is one of the main barriers to active travel.
The latest Government guidance states that roads with fewer than 2000 vehicles per day are suitable and safe for active travel.
The list below shows the average number of vehicles a day at each site and if it's below 2000, as stated by the government:
Lincoln Street
- Car, bus, LGV or motorbike: 415
- Pedestrian or cyclist: 106
- Fewer than 2000 vehicles per day? Yes
Ducie Road, north
- Car, bus, LGV or motorbike: 2,039
- Pedestrian or cyclist: 2,931
- Fewer than 2000 vehicles per day? No
Junction of Ducie Road and Morton Street
- Car, bus, LGV or motorbike: 1,688
- Pedestrian or cyclist: 725
- Fewer than 2000 vehicles per day? Yes
Ducie Road, middle
- Car, bus, LGV or motorbike: 2,922
- Pedestrian or cyclist: 2,016
- Fewer than 2000 vehicles per day? No
Ducie Road, south
- Car, bus, LGV or motorbike: 2,808
- Pedestrian or cyclist: 307
- Fewer than 2000 vehicles per day? No
Cobden Street
- Car, bus, LGV or motorbike: 2,747
- Pedestrian or cyclist: 2,326
- Fewer than 2000 vehicles per day? No
Morley Street
- Car, bus, LGV or motorbike: 2,648
- Pedestrian or cyclist: 1,238
- Fewer than 2000 vehicles per day? No
Church Street
- Car, bus, LGV or motorbike: 3,286
- Pedestrian or cyclist: 1,959
- Fewer than 2000 vehicles per day? No
Great Western Lane
- Car, bus, LGV or motorbike: 376
- Pedestrian or cyclist: 313
- Fewer than 2000 vehicles per day? Yes
Marsh Lane
- Car, bus, LGV or motorbike: 4,138
- Pedestrian or cyclist: 1,846
- Fewer than 2000 vehicles per day? No
Junction of Avonvale Road and Marsh Lane
- Car, bus, LGV or motorbike: 5,393
- Pedestrian or cyclist: 1,676
- Fewer than 2000 vehicles per day? No
Victoria Avenue
- Car, bus, LGV or motorbike: 823
- Pedestrian or cyclist: 897
- Fewer than 2000 vehicles per day? Yes
Victoria Avenue
- Car, bus, LGV or motorbike: 526
- Pedestrian or cyclist: 1,042
- Fewer than 2000 vehicles per day? Yes
Netham Road
- Car, bus, LGV or motorbike: 2,126
- Pedestrian or cyclist: 777
- Fewer than 2000 vehicles per day? No
Cossham Road
- Car, bus, LGV or motorbike: 1,252
- Pedestrian or cyclist: 584
- Fewer than 2000 vehicles per day? Yes
Beaufort Road
- Car, bus, LGV or motorbike: 4,027
- Pedestrian or cyclist: 734
- Fewer than 2000 vehicles per day? No
Our traffic counts on the main roads next to the scheme area
The list below shows the average number of vehicles a day at each site on the main roads:
Pilemarsh
- Car, bus, LGV or motorbike: 14,559
- Pedestrian or cyclist: 1,580
- Fewer than 2000 vehicles per day? No
Blackswarth Road
- Car, bus, LGV or motorbike: 13,073
- Pedestrian or cyclist: 2,058
- Fewer than 2000 vehicles per day? No
Crews Hole Road
- Car, bus, LGV or motorbike: 6,211
- Pedestrian or cyclist: 607
- Fewer than 2000 vehicles per day? No
Blackswarth Road South
- Car, bus, LGV or motorbike: 13,106
- Pedestrian or cyclist: 1,028
- Fewer than 2000 vehicles per day? No
Chalks Road
- Car, bus, LGV or motorbike: 9,266
- Pedestrian or cyclist: 4,912
- Fewer than 2000 vehicles per day? No
Church Road
- Car, bus, LGV or motorbike: 12,935
- Pedestrian or cyclist: 2,947
- Fewer than 2000 vehicles per day? No
Church Road
- Car, bus, LGV or motorbike: 16,924
- Pedestrian or cyclist: 2,505
- Fewer than 2000 vehicles per day? No
Church Road (Glebe Road)
- Car, bus, LGV or motorbike: 18,258
- Pedestrian or cyclist: 1,111
- Fewer than 2000 vehicles per day? No
Church Road
- Car, bus, LGV or motorbike: 14,413
- Pedestrian or cyclist: 2,725
- Fewer than 2000 vehicles per day? No
Netham Lock
- Car, bus, LGV or motorbike: 11,109
- Pedestrian or cyclist: 1,473
- Fewer than 2000 vehicles per day? No
Netham Lock
- Car, bus, LGV or motorbike: –
- Pedestrian or cyclist: 555
- Fewer than 2000 vehicles per day? –
We've been collecting air quality data from 12 sensors within the scheme area and a further 6 sensors just north of the area.
We'll continue to monitor this closely, but we need a full year of data before we can draw any conclusions.
You can see our comments on air quality on page 113 of the EBLN Monitoring Report
Explore historic and live air quality data on our Open Data website.